Overview
During its rebrand, Dell identified the Compare Page as a critical pain point: 1 in 10 users (10.4%) exited at this step. With millions of monthly visitors, every percentage point of exit rate was real lost revenue. As Product Design Lead, I guided research, design, and cross-functional collaboration to reduce drop-offs and improve decision confidence.
The problem
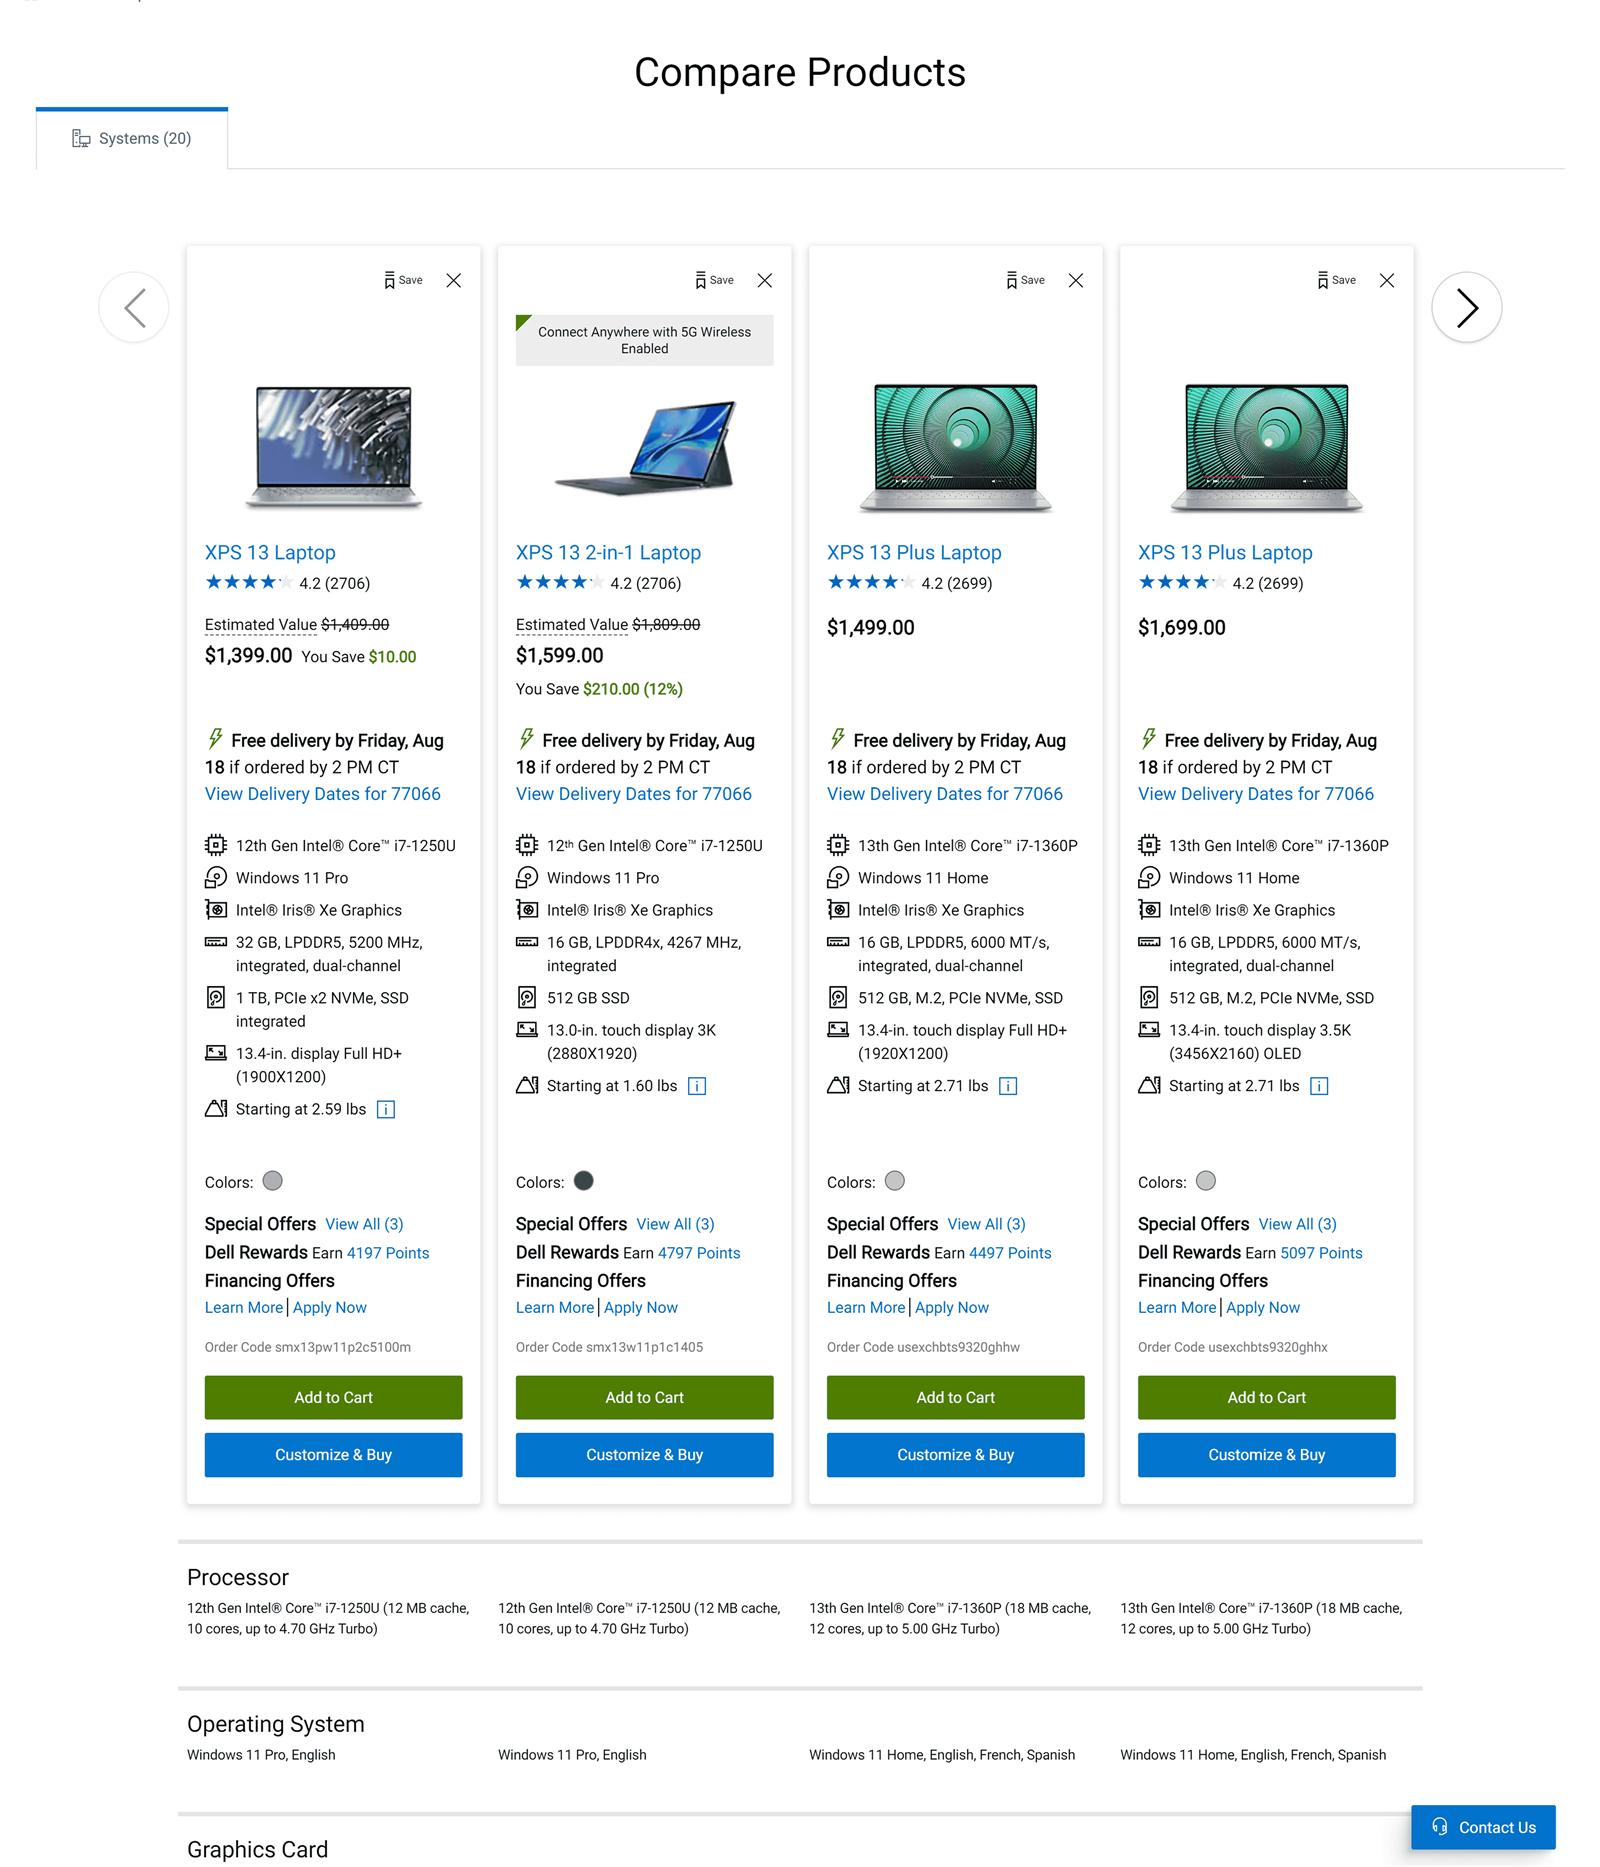
The existing page was cluttered, hard to scan, and behind competitor experiences. Customers couldn't see meaningful differences between products and abandoned the process, leaving without selecting anything at all.
The challenge
Design a comparison experience that is clear, accessible, and confidence-building, while accommodating Dell's expanding product categories.
Baseline study & user flow
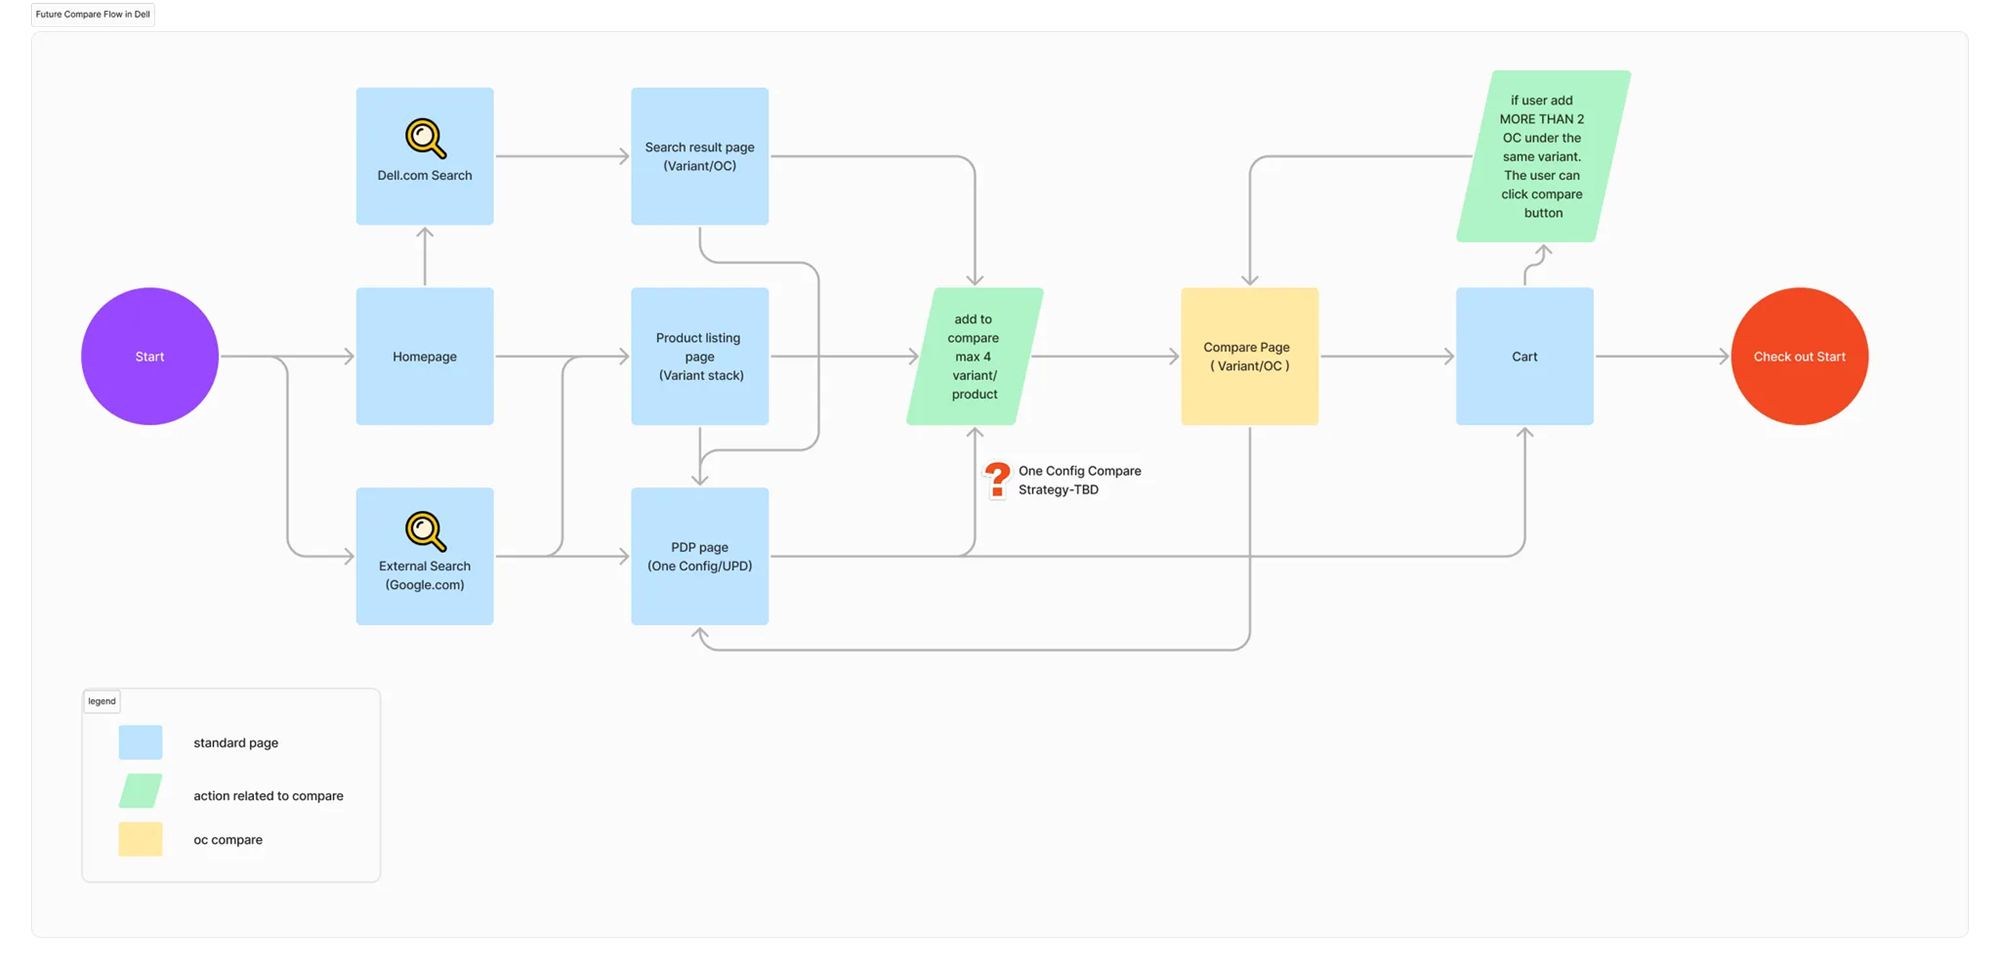
Before touching an enterprise-level redesign, I ran a baseline study: reviewing existing designs with the product owner and project manager to avoid duplicating prior work, and mapping the complete user flow to understand where users entered the comparison experience.
Research & benchmarking
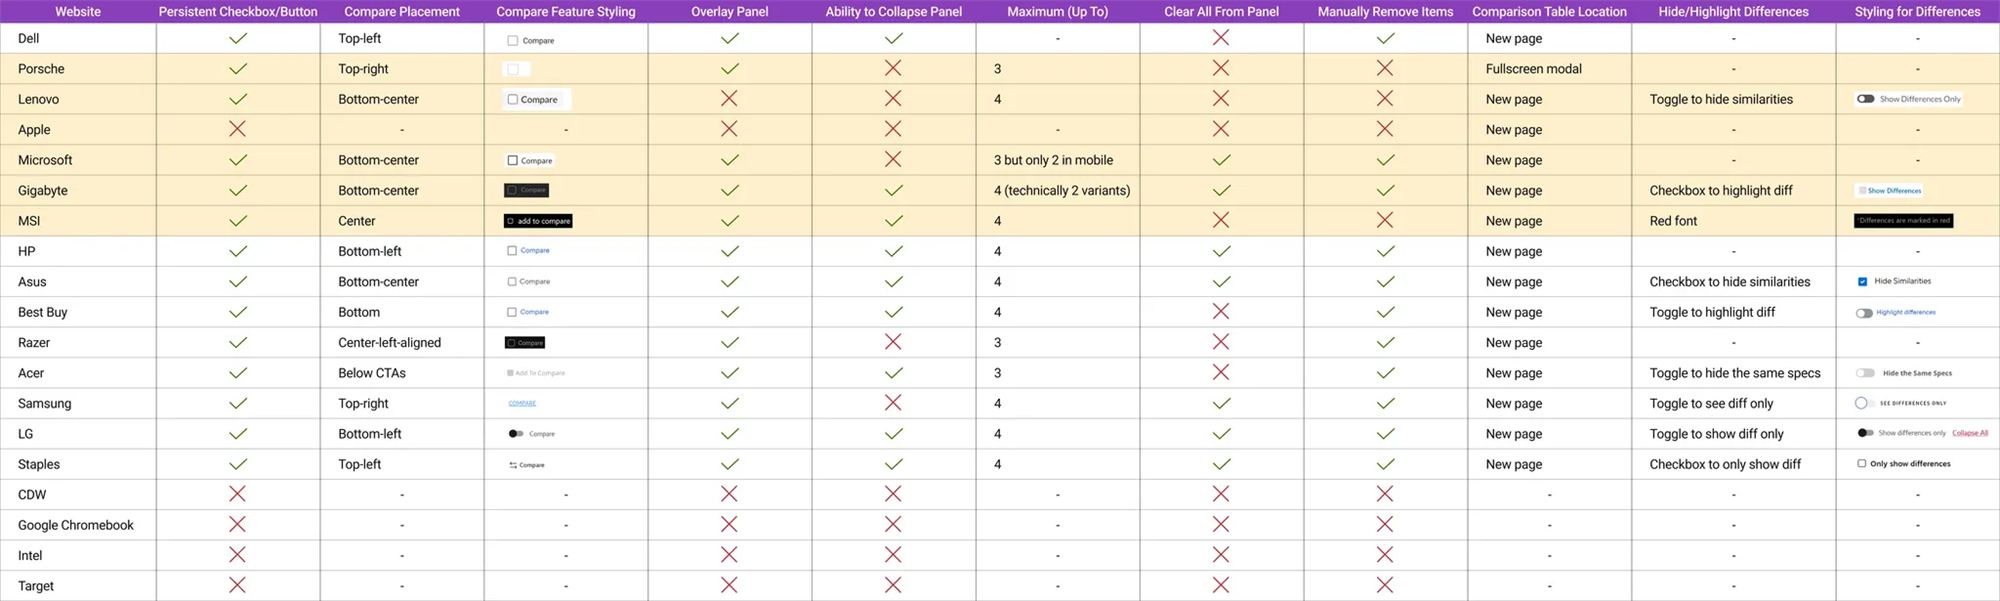
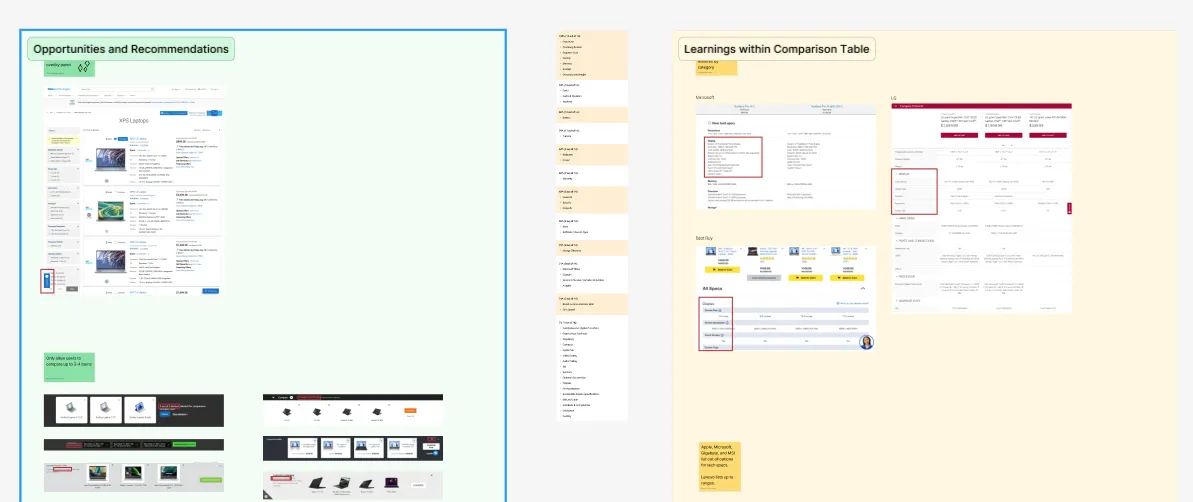
We benchmarked 19 competitor platforms, Asus, HP, Lenovo, Apple, and found common patterns: grouped specifications, persistent CTAs, and simplified layouts built for scanning. Dell's page felt overwhelming by comparison: dense, cluttered, hard to navigate.
What user testing revealed
- Overwhelming information density made skimming impossible
- Inconsistent formatting and repeated specifications created confusion
- Small text hurt readability, especially on mobile
- Horizontal scrolling on mobile frustrated users
- Users couldn't tell which specs actually mattered for their decision
- Technical jargon lacked plain-language explanations
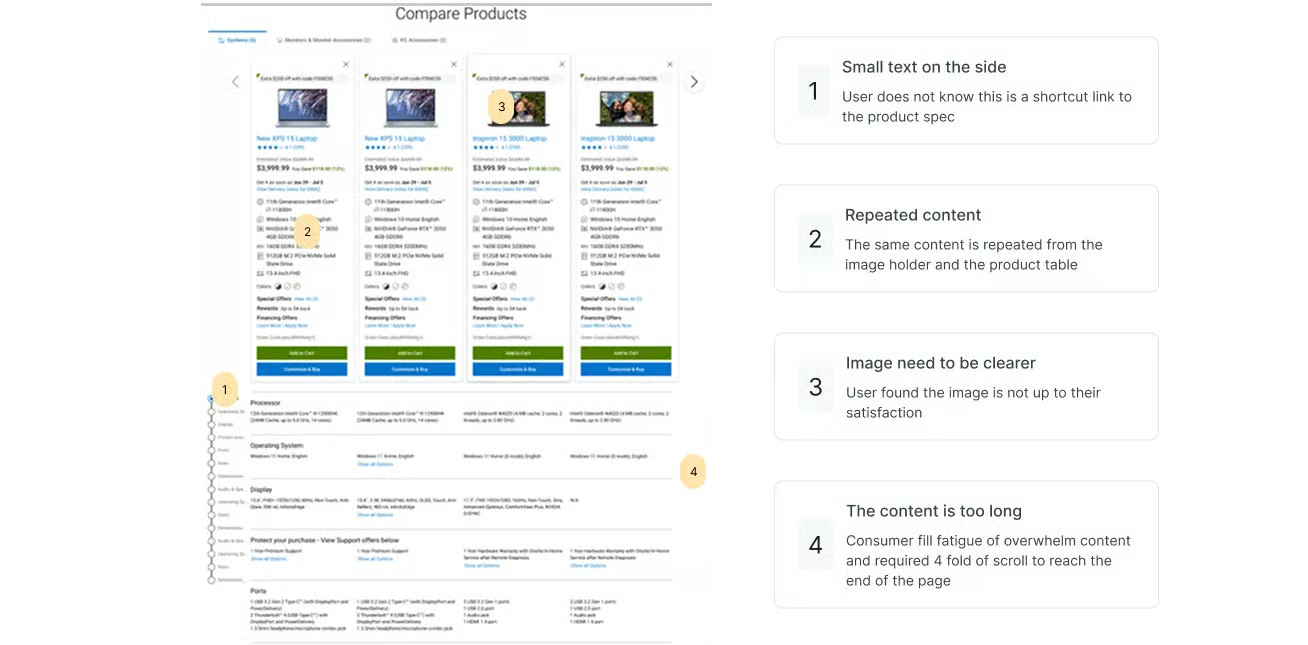
"I don't know what half of these specs mean or why I should care about them."Usability session participant
Personas reframed the problem
- Parent Paula: price-sensitive, seeking best value for the family
- Gamer Glen: spec-driven, comparing high-performance features
- Shopper Sam: everyday buyer needing clarity and speed
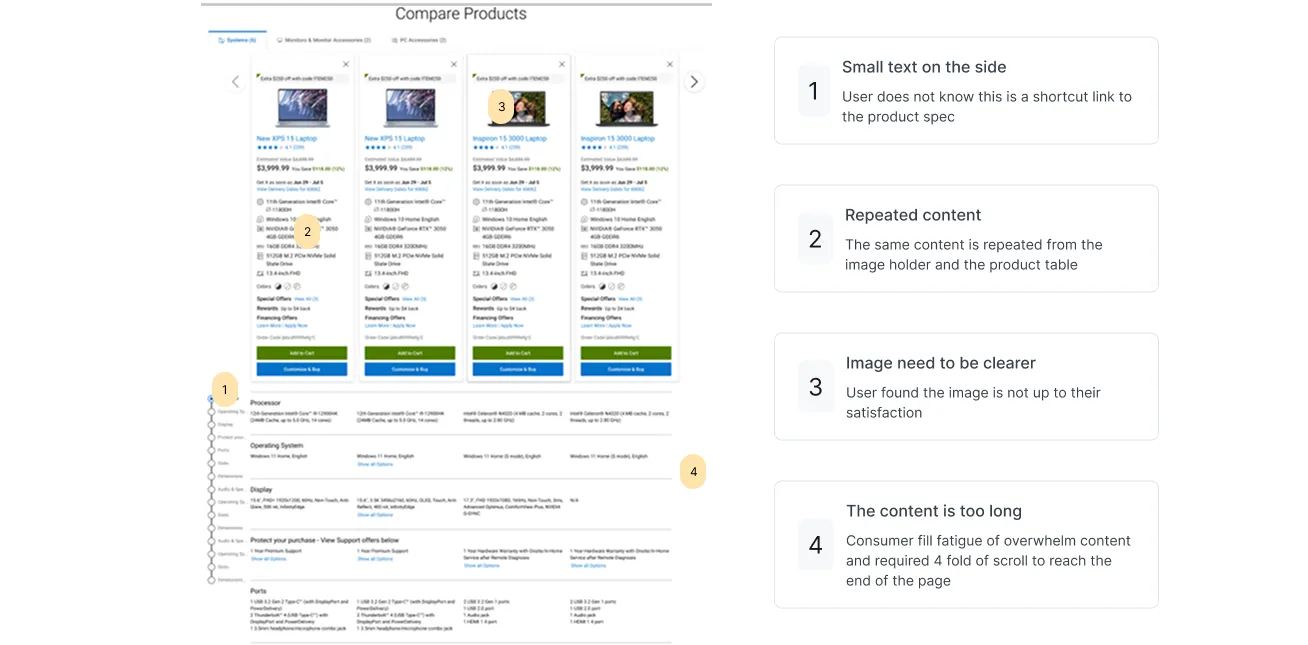
Users weren't abandoning because they didn't want to buy. They were abandoning because comparison felt too complex. Over 18 months we ran 200+ research sessions, A/B testing, card sorting, preference testing, session replays, and heatmap analysis across regions and segments.
Stakeholder realignment
With research complete, I built a comprehensive stakeholder presentation: wireframe drafts, competitor analysis, opportunities, and design recommendations. This alignment session was critical, it got cross-regional teams in the USA, India, China, and Ireland agreeing on priorities before we invested in high-fidelity design.
Ideation & design
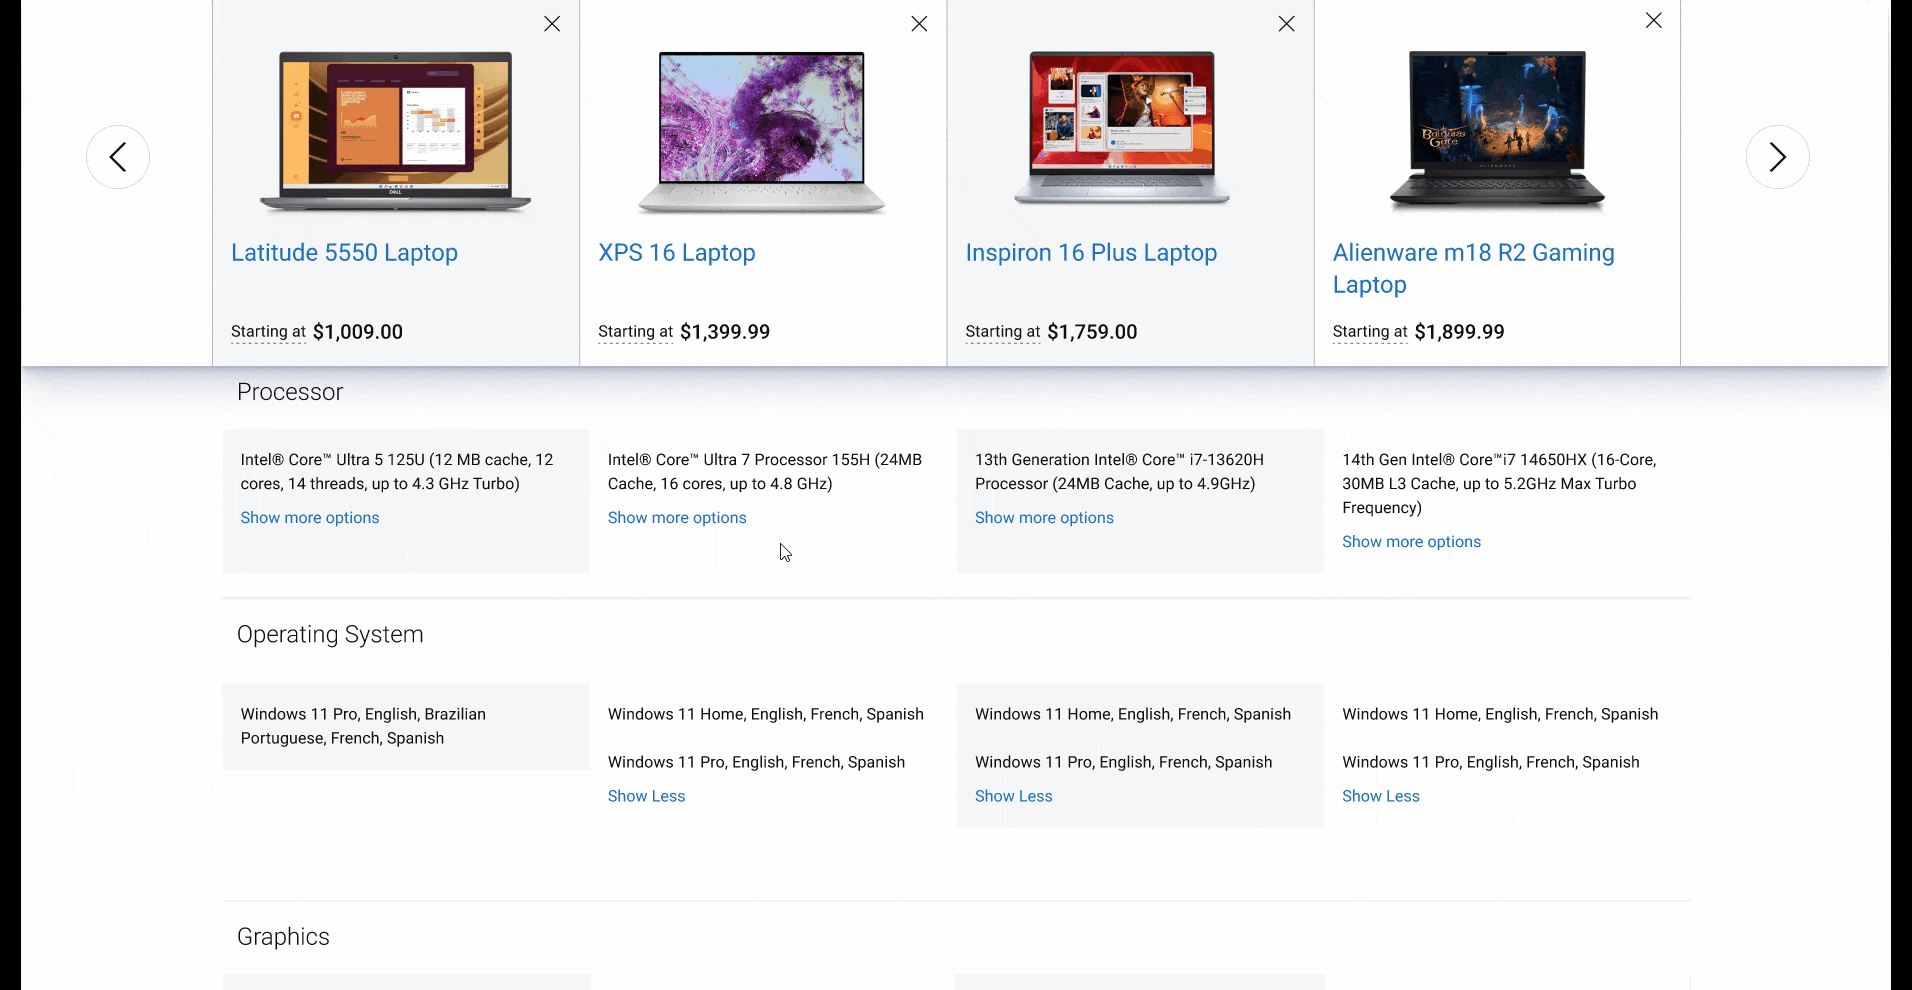
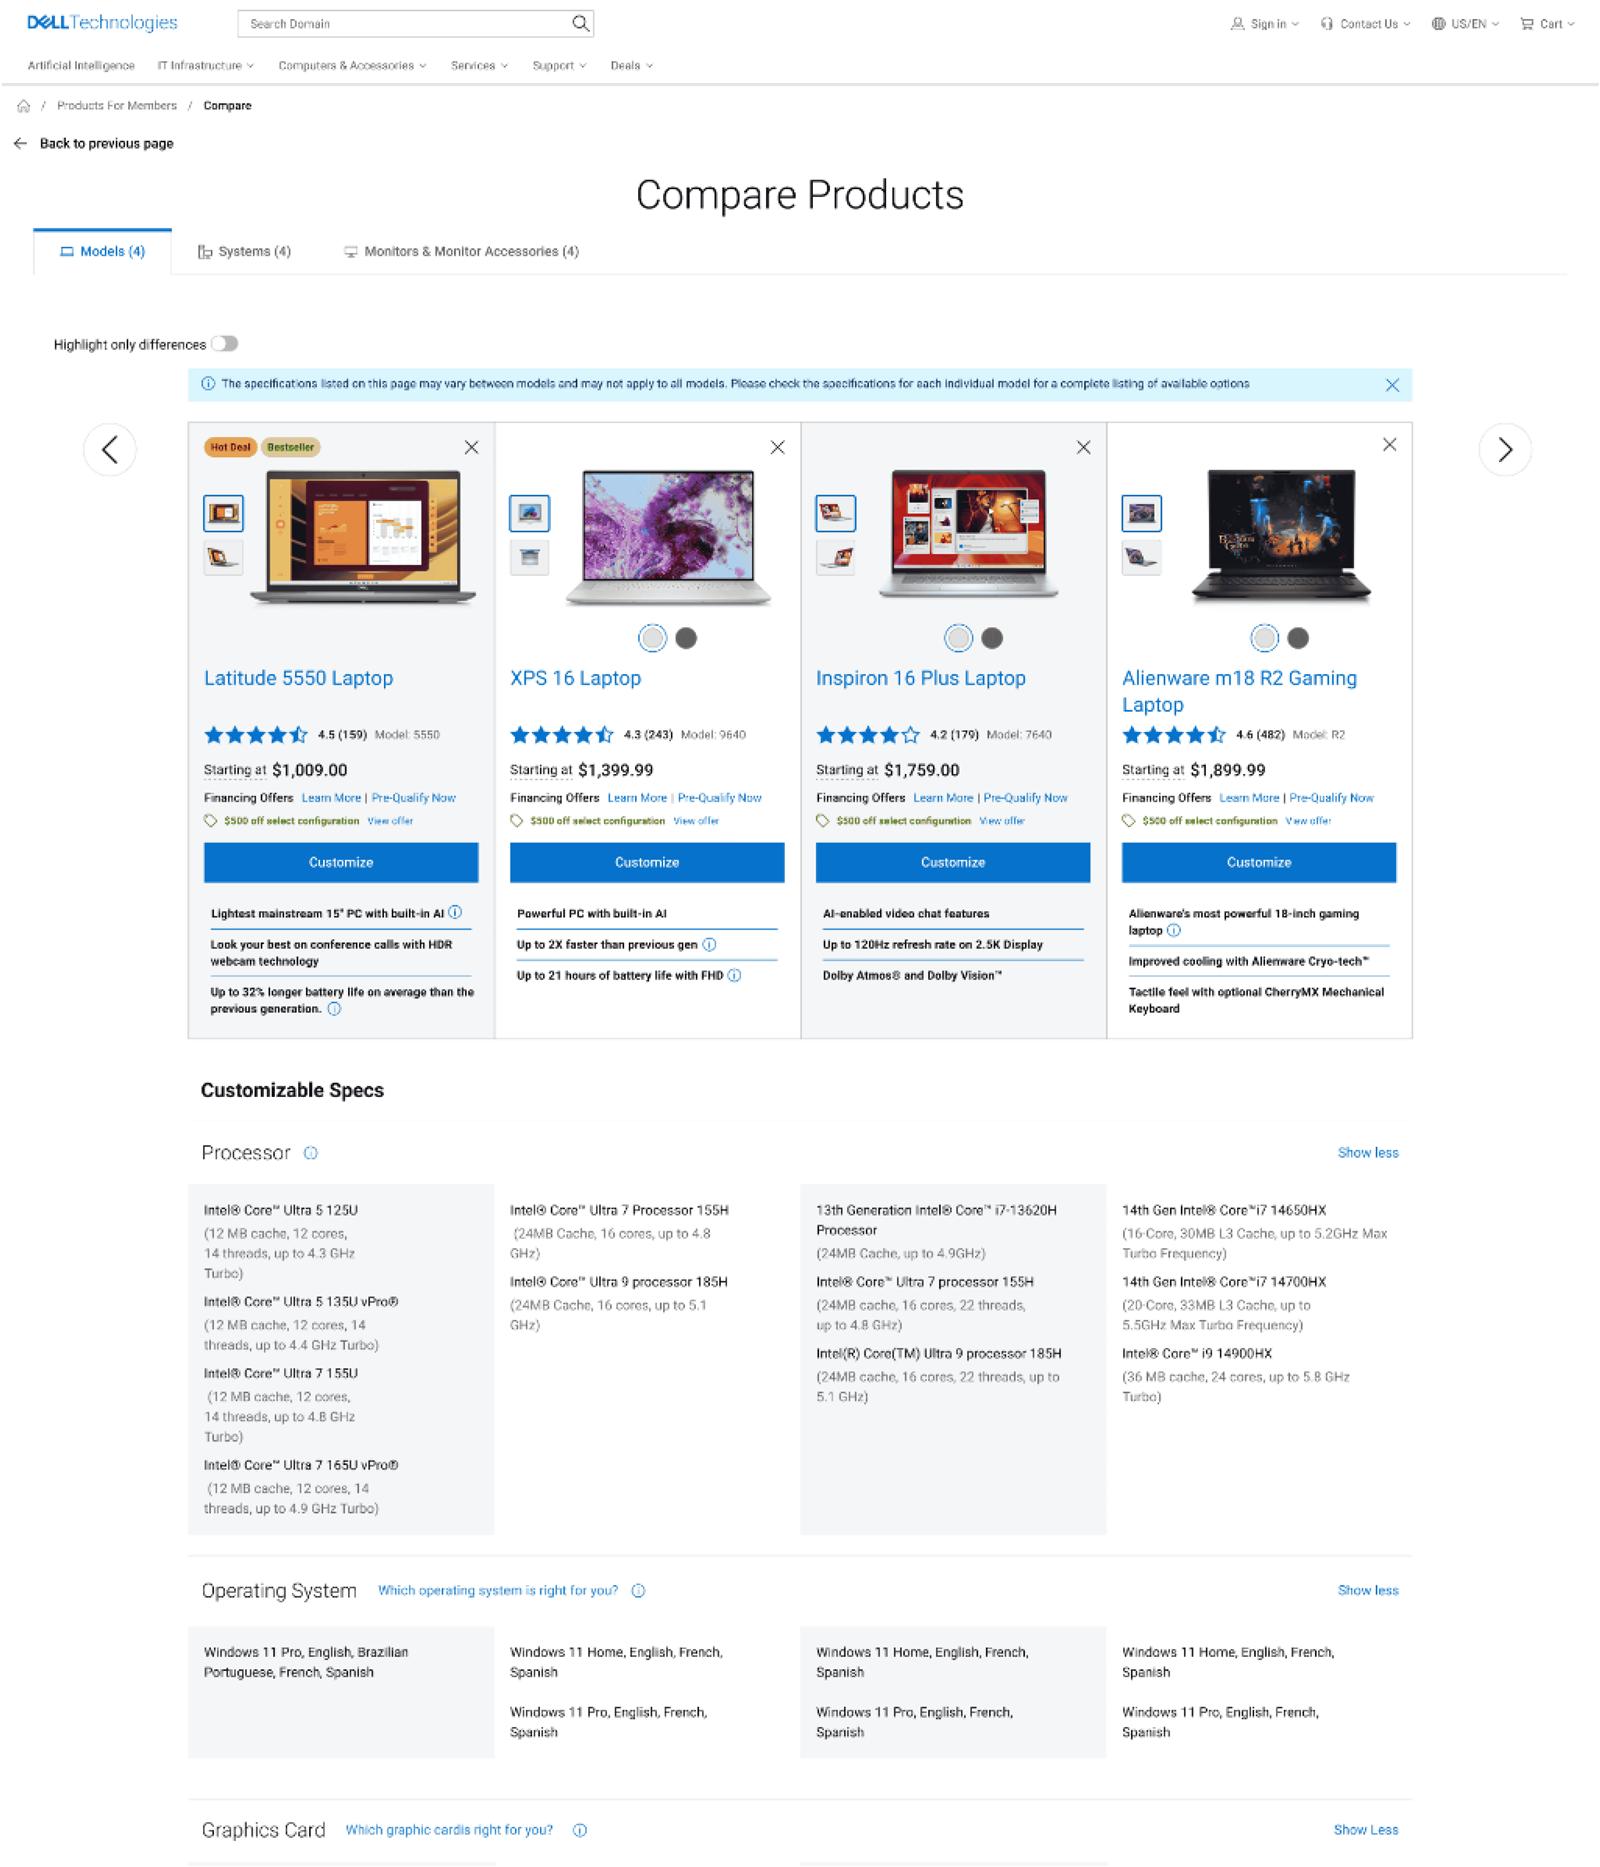
I led the team through wireframes and prototypes that grouped specifications logically, introduced sticky CTAs, and highlighted key differences visually, solutions focused on clarity and confidence.
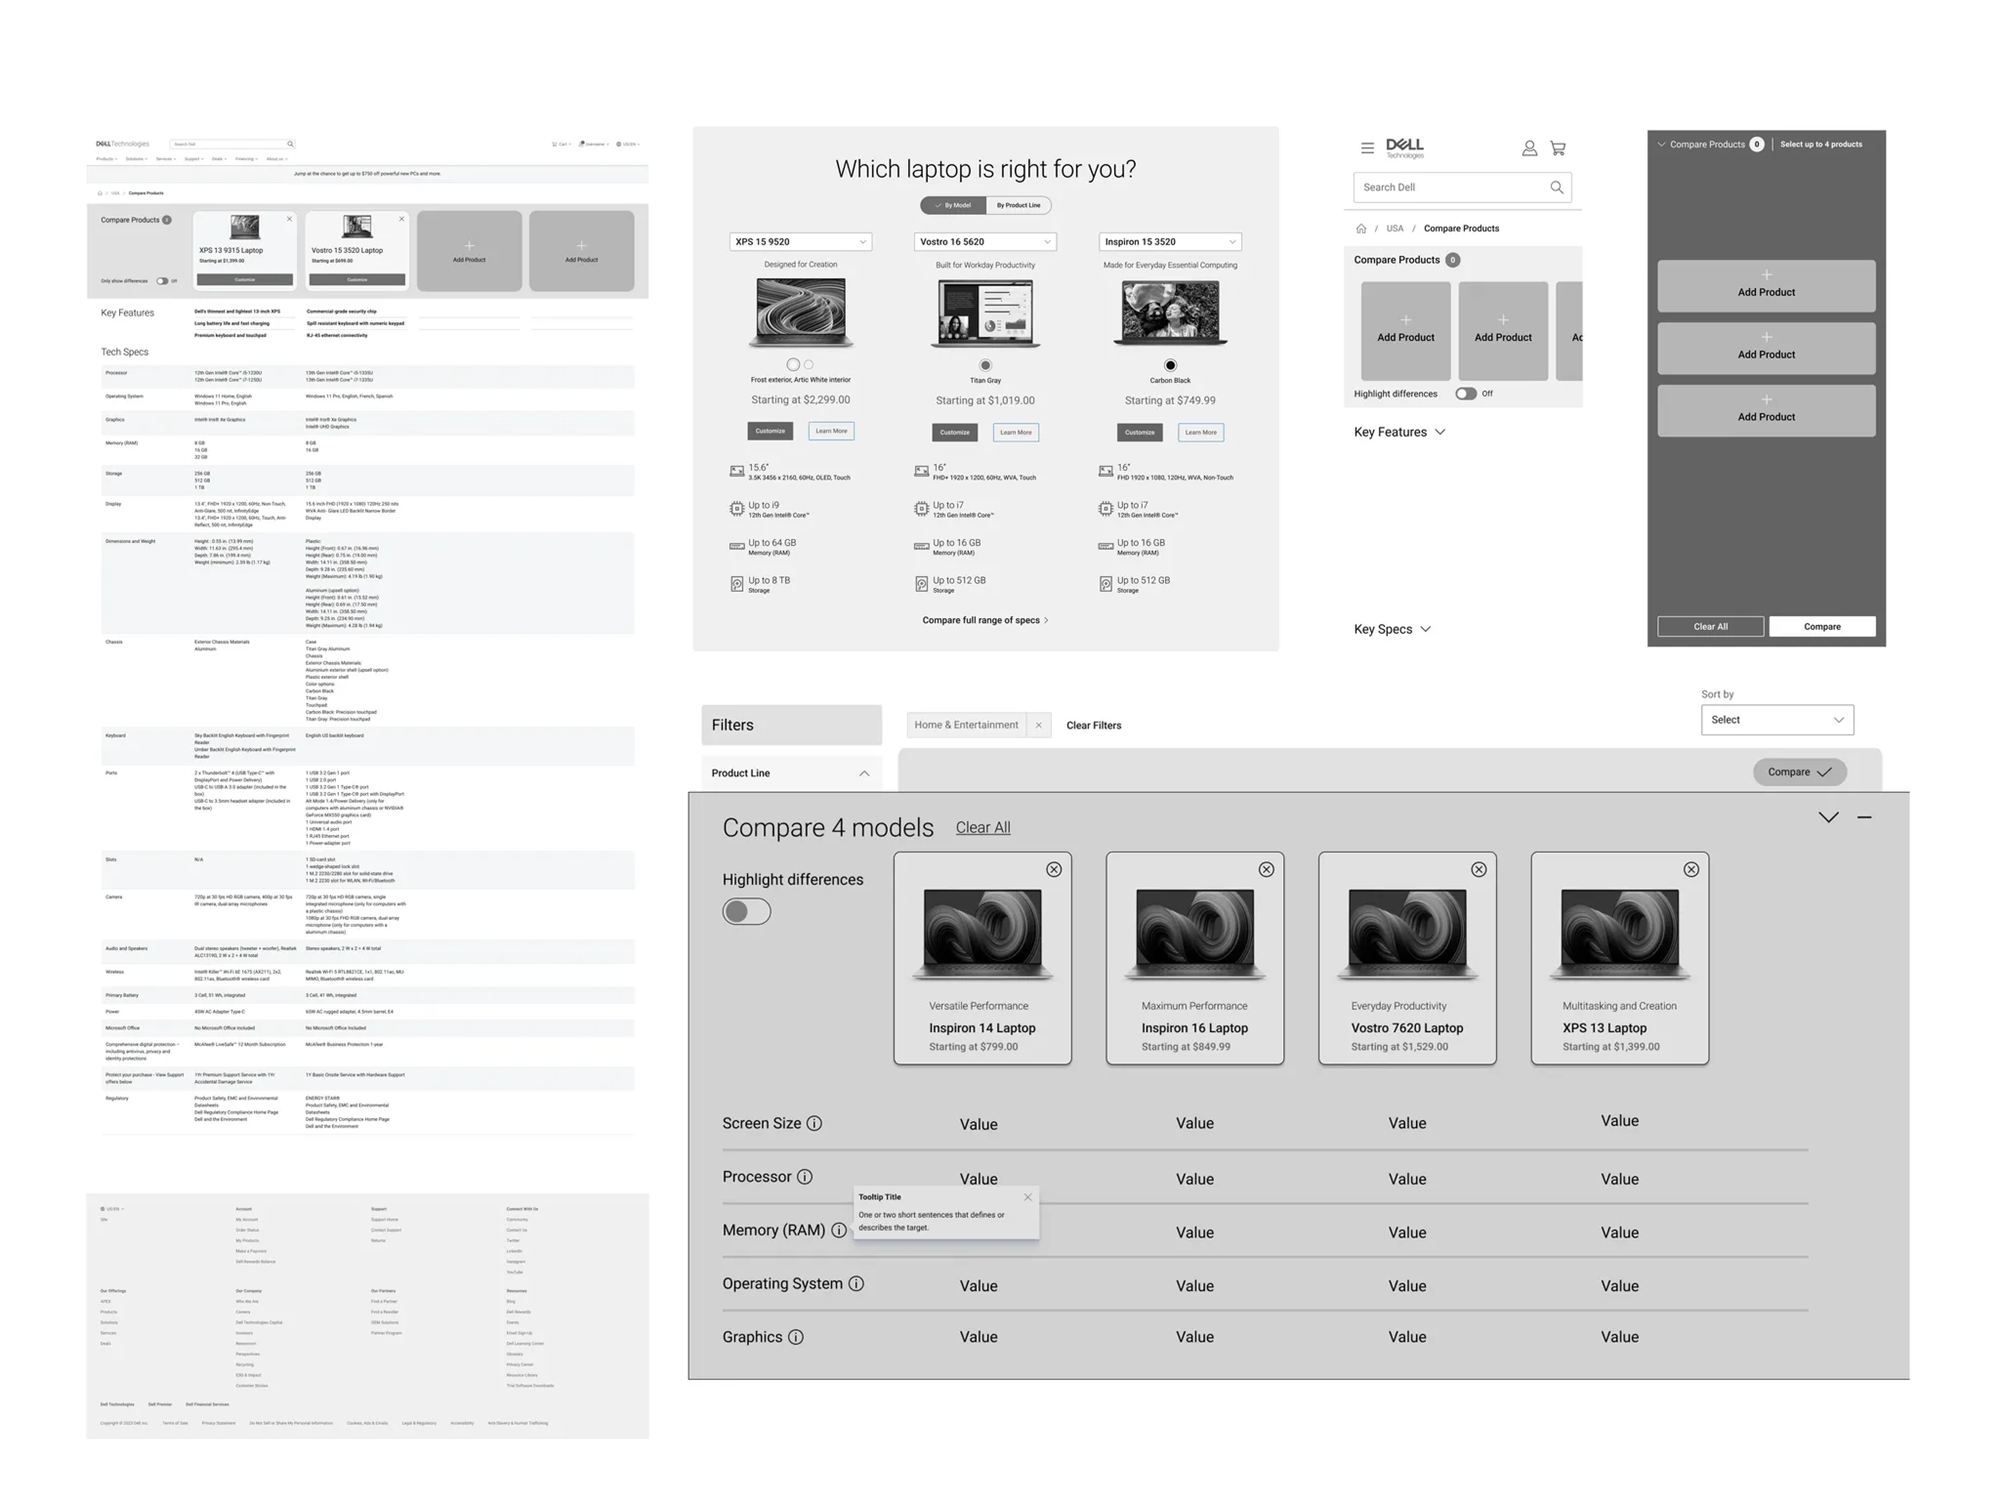
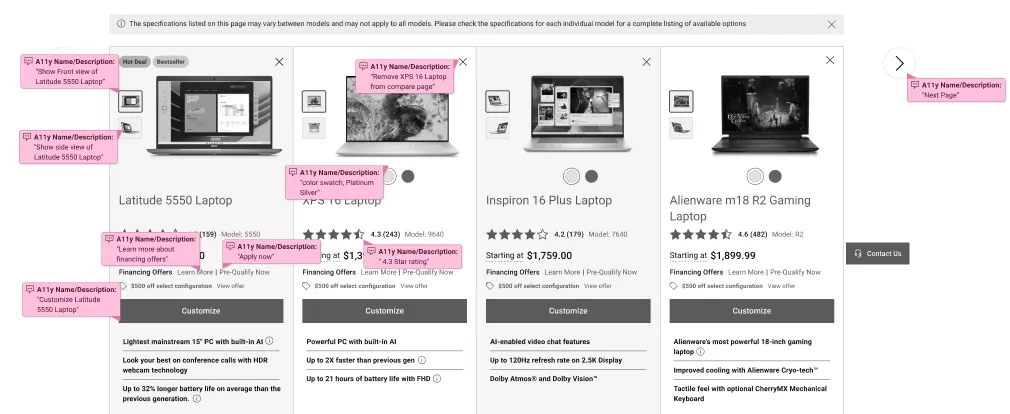
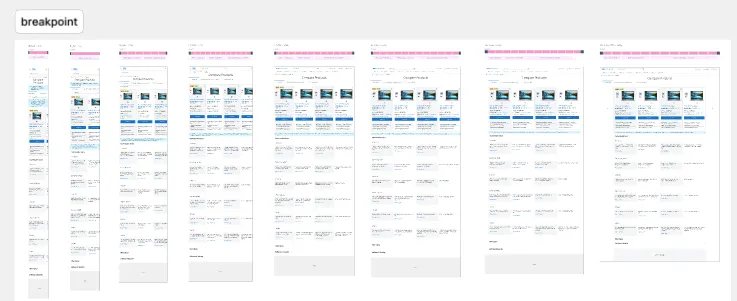
Accessibility was a priority from day one. Every design shipped with WCAG-compliant annotations for developers, and we collaborated closely to ensure layouts were both usable and technically feasible across breakpoints.
Testing & iteration
In moderated usability sessions, users immediately noticed how much easier the new design was to scan and compare.
"I can actually see what's different now without scrolling back and forth."Usability session participant
We went further: accessibility testing with an impaired user ensured the redesign wasn't just cleaner, but truly inclusive. Iterations from those sessions gave us confidence we were building for all users, not just some.
Outcome
Following a phased global rollout across four regions, we measured results three months post-launch:
Beyond the numbers, the project delivered a reusable comparison framework Dell could apply to other product categories, and set a new standard for embedding accessibility and research-driven design into its global e-commerce strategy.
Also at Dell: I designed for Dell's Black Friday sale, which brought profit up 3% compared with the previous year's Black Friday.
Key takeaway
Users don't abandon because of bad products. They abandon because of bad clarity.
By simplifying the design, embedding accessibility, and aligning a global team around a shared goal, we turned a high-friction step into a growth driver for Dell's e-commerce journey.
What I'd do differently
Audit prior research first. Midway through, we discovered patterns like grouped specs and sticky CTAs had already been validated in earlier Dell research, centralizing findings upfront would have saved 3–4 weeks of discovery.
And test accessibility at the wireframe stage, not high fidelity. We caught screen reader navigation issues late that required rework; testing earlier would have prevented those iteration cycles entirely.