The challenge
A government agency managing investment portfolios across multiple countries ran entirely on manual Excel reporting. Operations analysts spent over 4 hours a day building charts by hand. Executives sometimes discovered anomalies weeks after they occurred. And the dataset had 50 columns with no clear sense of which information actually drove decisions.
Research
- Analyzed the actual Excel files analysts used daily
- Shadowed staff through their manual workflows
- Interviewed executives from three competing departments
- Mapped complete user journeys from data export to decision
Key finding
Only 12–15 of the 50 columns drove 80% of decisions. Progressive disclosure could surface the critical few and tuck away the rest.
The "Color Wars"
Three department heads each wanted their organizational color dominating the shared dashboard. Instead of choosing subjectively, and making two enemies, I ran WCAG AAA contrast testing and colorblind simulations:
- Department A's blue failed contrast requirements
- Department B's green failed the red-green colorblind simulation
- Department C's red conflicted with UX conventions (red = error/danger)
Reframing the discussion from "which color do you prefer?" to "which colors are accessible and inclusive?" turned a political standoff into unanimous consensus.
Design-through-code
Rather than traditional mockups, I designed directly in production code. Executives reviewed real visualizations of real investment data and made immediate decisions about chart types and layouts, a fast feedback loop years before "vibe coding" had a name.
Visualization choices
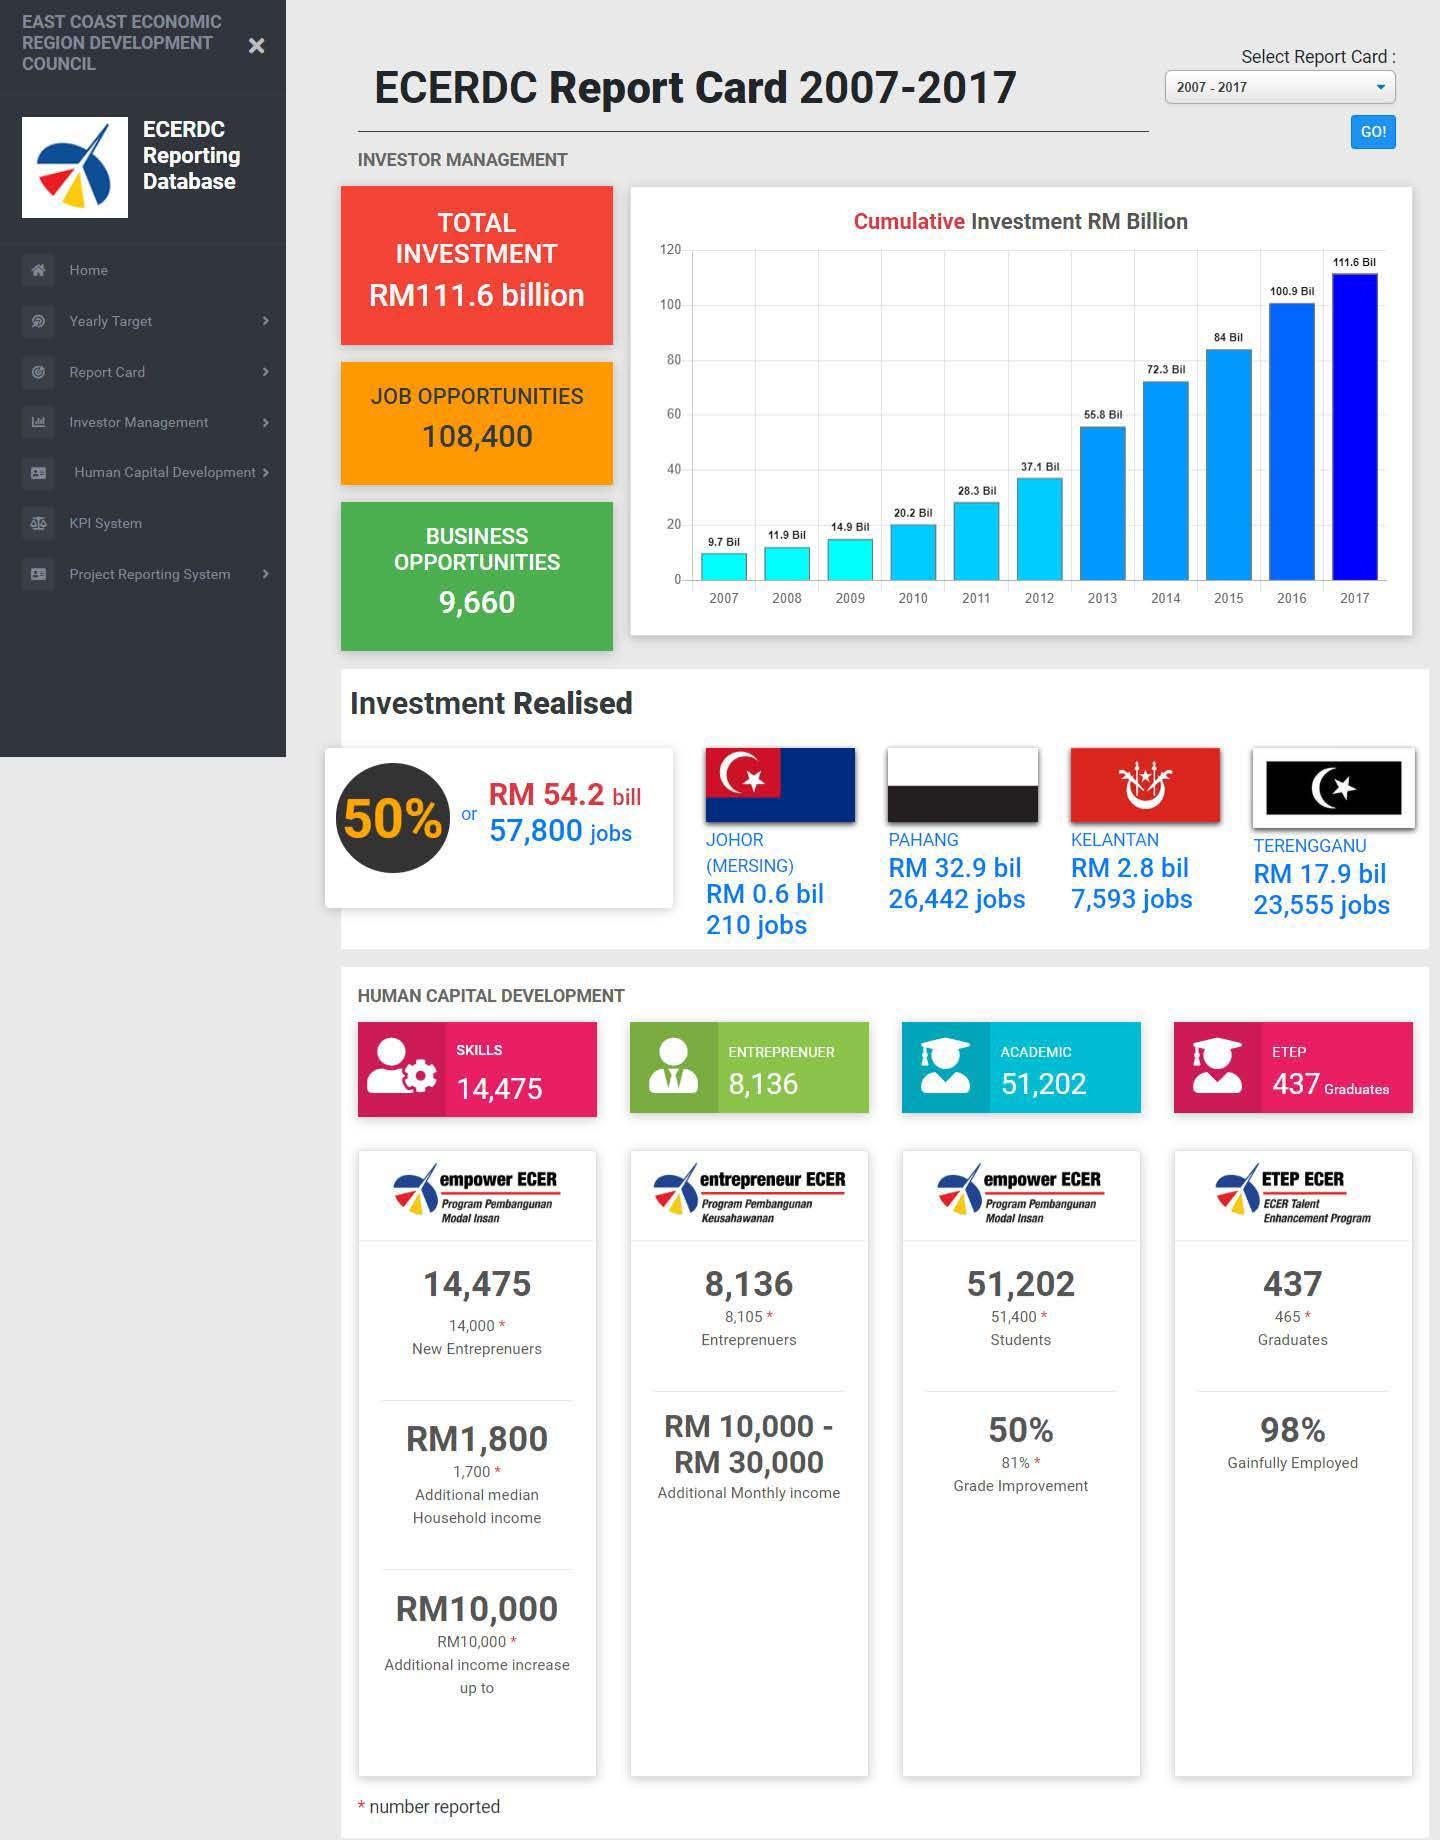
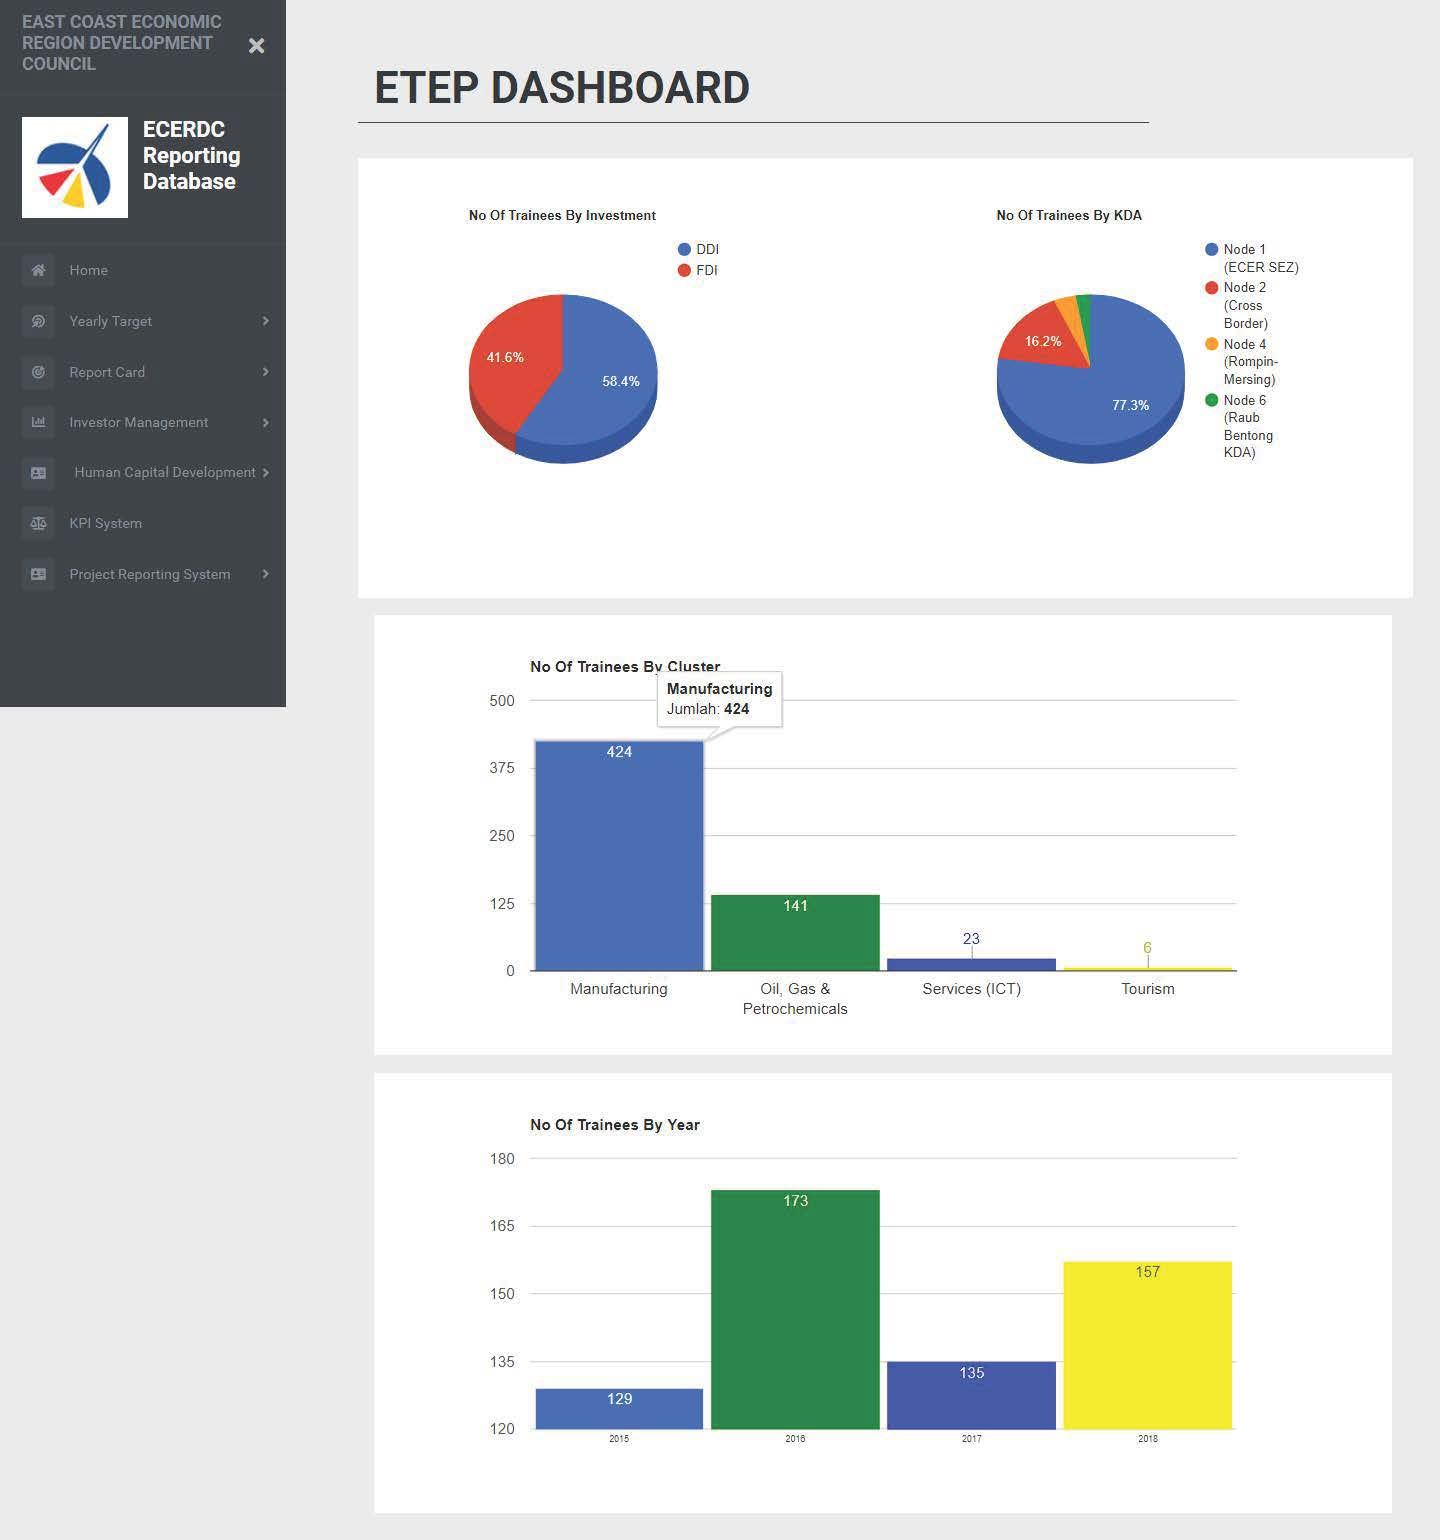
Familiarity beat novelty. Standard chart types meant zero learning curve:
- Bar charts for comparisons
- Line charts for trends
- Pie charts for distribution
- KPI cards for key metrics
Deliverables & outcome
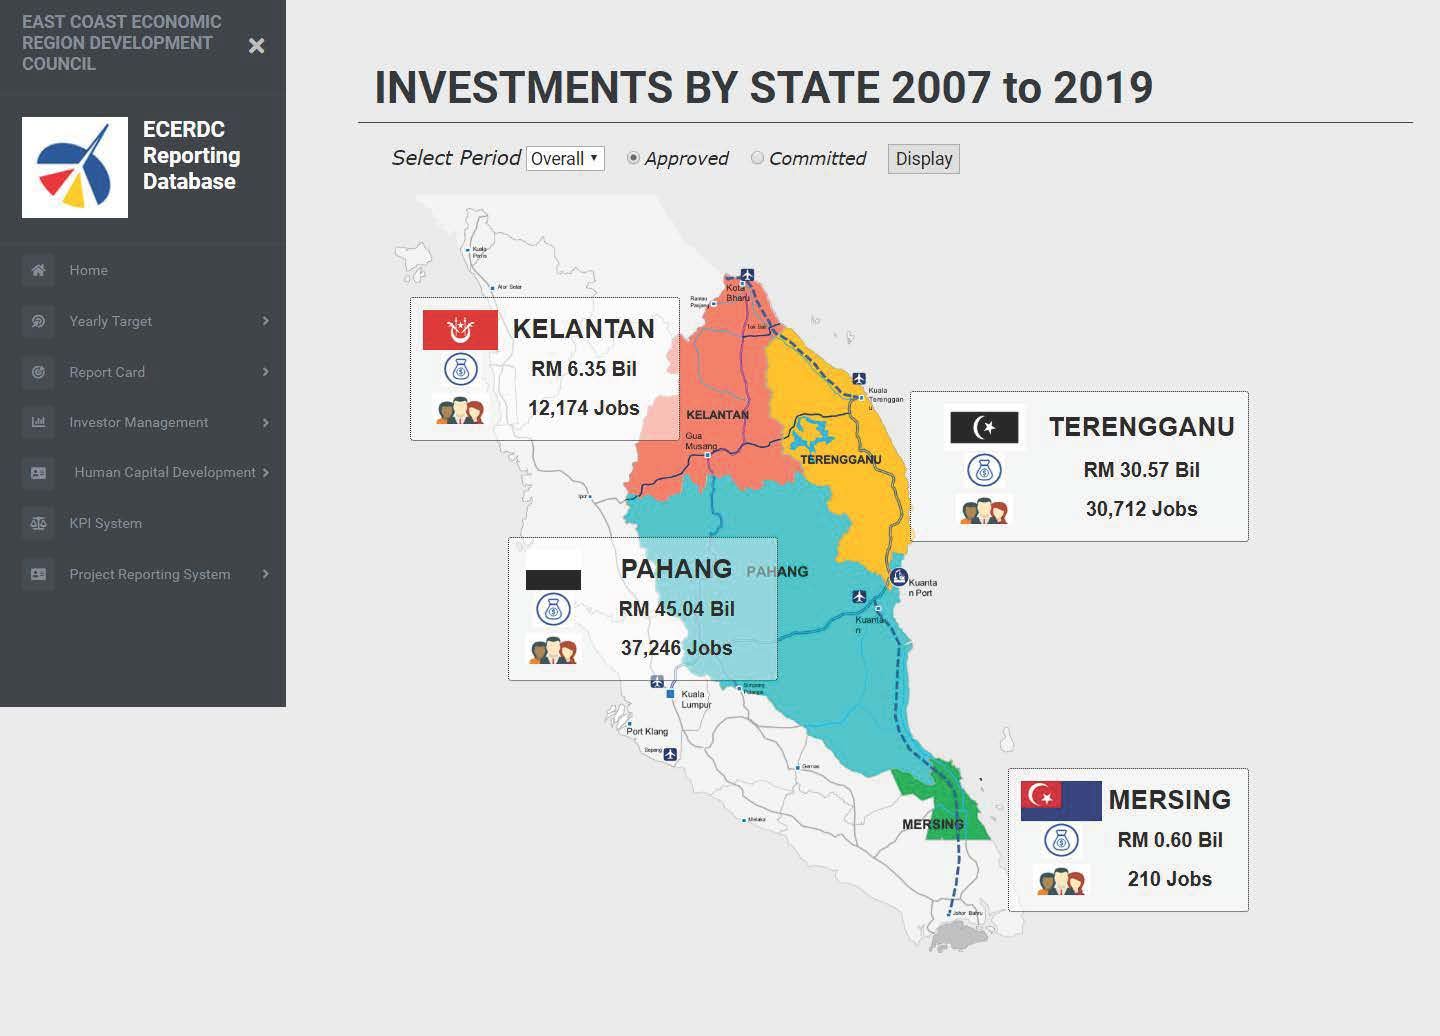
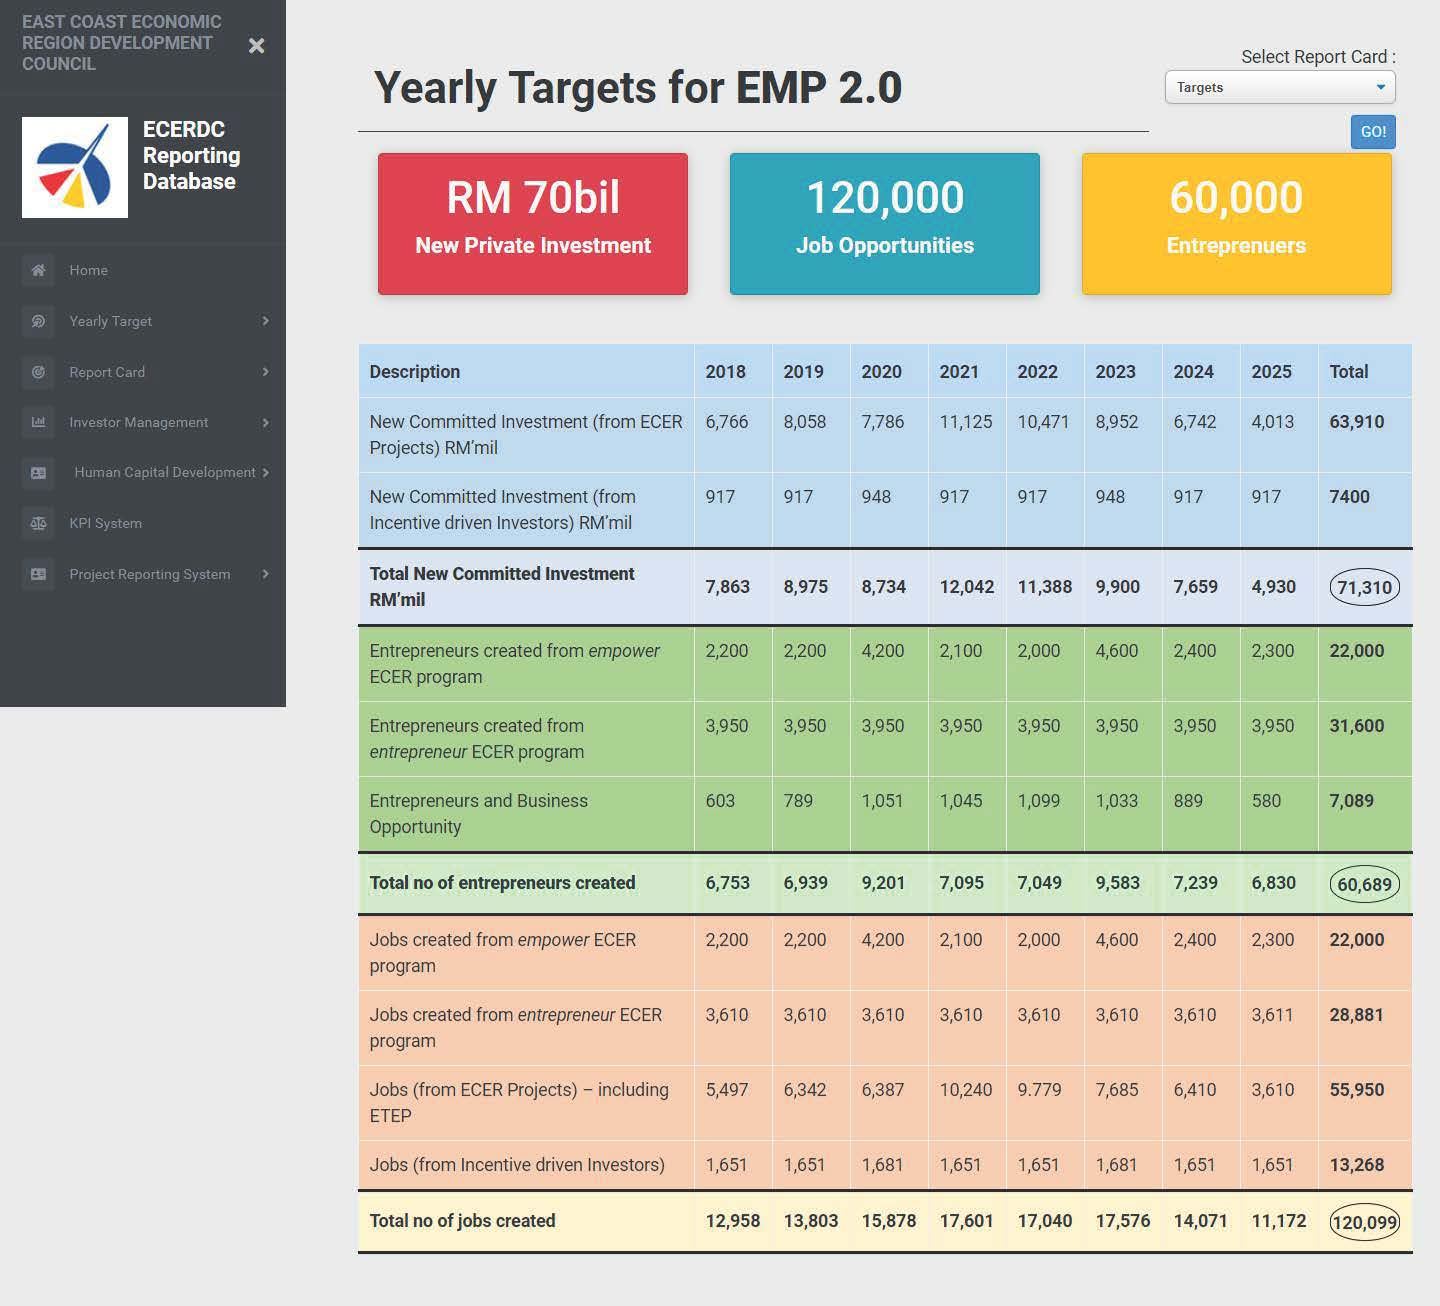
The real-time dashboard replaced manual Excel workflows with a responsive layout for desktop and tablet, enabling real-time executive decision-making and eliminating version control chaos. The project was paused before full production launch due to organizational restructuring, but the methodology and the accessibility-led consensus held lessons I still use.
What I learned
- Test accessibility at the wireframe stage: post-design screen reader issues forced rework that earlier testing would have prevented.
- Prototype with real data before coding: Figma prototypes with actual data would have made layout testing faster.
- Designing in code was ahead of its time: this 2018 methodology parallels today's AI-assisted rapid prototyping workflows.